These menu options allow the configuration of the toolbar and the MDI windows. Not all the available windows are visible at all times and this menu, which enumerates them all, can be used to bring a hidden window to the front.
Toolbar
Brings up a child menu allowing selection of the various optional toolbar sections to be shown.
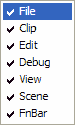
| File | File load and save options |
|---|---|
| Clip | Clipboard options |
| Edit | Search and replace and object options |
| Debug | Debugger options (available only in debugger) |
| View | Buttons to enable the component windows as controlled by the view menu |
| Scene | Buttons for the available scenes |
| FnBar | A combo box for entering expressions |
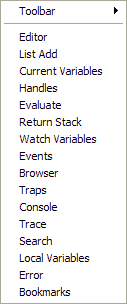
Window list
The second half of the menu contains a list of the available windows. Clicking on one will ensure it will be made visible. If already displayed then nothing will happen.
| Editor | The main editor/debugger window. |
|---|---|
| List Add | Shows names of the current programs in memory. |
| Current variables | Display variable used around current stopped execution point. |
| Handles | Displays any KISAM handles open. |
| Evaluate | Displays all evaluations that have take place. |
| Return Stack | Shows the current RETURN stack in the debugger. Similar to the LIST RETURN dialog but it is always kept up to date while the debugger is active. |
| Watch variables | Displays variables and expressions currently being watched. |
| Events | Shows an event history for forms. |
| Browser | Allows browsing forms, controls, objects and files. |
| Traps | Shows any current breakpoints. |
| Console | The old console window for immediate mode commands. |
| Trace | Output from the TRACE command tracing program execution. |
| Search | The search results window. |
| Local Variables | Displays local variables. This is the list of local variables in the current stack frame. |
| Error | The compiler error window. |
| Bookmarks | The bookmark list window. |
| Execute | The output window or form. |