TRACE
General Form:
The TRACE statement is a debugging tool which produces a trace of program operations. Trace mode is turned on when the TRACE or TRACE ON statement is either executed within a program or entered in Immediate Mode. Trace mode is turned off by executing a TRACE OFF, or by executing a CLEAR command.
Trace reports on GOTO and GOSUB branches, RETURN statements, FOR ... NEXT statements, WHILE ... WEND and REPEAT UNTIL .loops, SELECT CASE statements, and also trailing statements on TRAP statements. It logs the line and statement number and the program name of the statement. Subroutines names and the value of any arguments are shown and reported statements within the routine are indented to show nesting.
Output normally goes to the trace window of the Workbench debugger, if running. If the program is not running under the control of the workbench then trace output goes to the /005 device where it may interfer with other screen output. The SELECT TRACE statement allows trace output to be redirected to a file.
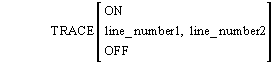
By specifying two line numbers TRACE output will appear only when the program is executing between the two specified line numbers. While executing outside this range no tracing occurs. While this form of TRACE is active, the interrupt key (Ctrl+BREAK) key will not stop execution until the program is executing a line within the specified range. Thus programs can be stepped through but standard subroutines in an overlay may be skipped.
See also: