Graph / Chart — worked example
A graph (.graph$) draws charts — bar, line, pie and
more — from data you push in at runtime. It can also tell you which bar or slice
the user clicked, so charts can be interactive.
Verified by execution on KCML 06.00.88 (KClient direct mode).
What it demonstrates
- Clearing the chart with
.Reset()and setting.Type. - Loading multiple data series with
.Data(set, index, value). - Titles, legends and X-axis labels.
- The
Click()event, which reports the clicked.ClickSet/.ClickIndex.
The program
01000 REM test_graph - chart control with sample data and click events
: DIM result, msg$80
01010 - DEFFORM GraphTest()=\
{.form,.form$,.Style=0x50c000c4,.Width=440,.Height=300,.Text$="Graph Test",.Id=1024},\
{.lblInfo,.static$,.Style=0x50000000,.Left=10,.Top=10,.Width=420,.Height=10,.Text$="Click a bar / slice - row + index logged below.",.Id=2000,.Font=.SegoeCtl},\
{.graph1,.graph$,.Style=0x50010000,.Left=10,.Top=30,.Width=420,.Height=200,.Id=2001},\
{.lblHit,.static$,.Style=0x50000000,.Left=10,.Top=235,.Width=420,.Height=10,.Text$="(no click yet)",.Id=2002,.Font=.SegoeCtl},\
{.btnClose,.button$,.Style=0x50010001,.Left=350,.Top=255,.Width=80,.Height=14,.Text$="Close",.Id=1,.Font=.SegoeCtl},\
{.paneStatus,.status$,.Width=440,.Style=0x50000000,.Text$="Ready"},\
{.SegoeCtl,.dlgfont$,.Name$="Segoe UI",.Size=10}
: + DEFEVENT GraphTest.Enter()
: .graph1.Reset()
: .graph1.Type = &.Bar
: .graph1.Data(1,1,42)
: .graph1.Data(1,2,58)
: .graph1.Data(1,3,30)
: .graph1.Data(1,4,71)
: .graph1.Data(2,1,20)
: .graph1.Data(2,2,40)
: .graph1.Data(2,3,60)
: .graph1.Data(2,4,55)
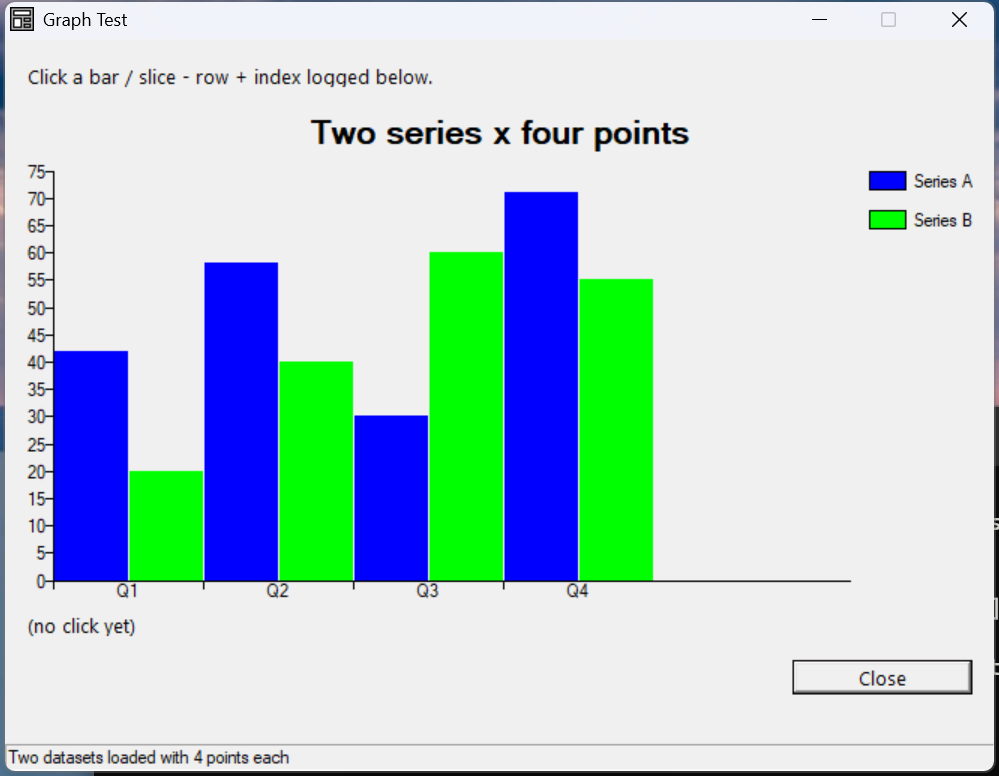
: .graph1.Text$ = "Two series x four points"
: .graph1.Legend(1, "Series A")
: .graph1.Legend(2, "Series B")
: .graph1.XLabel(1, "Q1")
: .graph1.XLabel(2, "Q2")
: .graph1.XLabel(3, "Q3")
: .graph1.XLabel(4, "Q4")
: END EVENT
: + DEFEVENT GraphTest.graph1.Click()
: .lblHit.Text$ = $PRINTF("Click set=%d index=%d", .graph1.ClickSet, .graph1.ClickIndex)
: END EVENT
: FORM END GraphTest
01020 result = GraphTest.Open()
: $END
How it works
Load data, then it draws itself. Call .Reset() to clear, set .Type
(&.Bar, &.Line, &.Pie, …), then push points with
.Data(set, index, value) — set is the series number, index is the point.
Two series of four points produces the grouped bars shown above.
Labels and legend. .Text$ is the chart title, .Legend(set, "name") names
each series, and .XLabel(index, "name") labels the category axis.
Interactivity. When the user clicks a bar or slice, the Click() event fires
and .ClickSet / .ClickIndex identify exactly which data point was hit — drill
down, highlight, or show detail from there.
See also
- graph — full reference (all chart types and options)